


Build your own Custom Visual Today!

Forget the Impact. Does your Data make Sense?

Augmented Insights at your Fingertips!

Support & Maintenance to Propel your Solutions
Build your own Custom Visual Today!
Services
Custom Visual
Visualize data your way, with our rich library of fully customizable, open-source data visualization tools. Use the Power BI visuals SDK to create stunning data visualizations based on well-
Report Design
A report consists of a data model, a layout, and a set of properties. Optionally, a report may also include a style template and a set of translations
Data Modeling
Data modeling is the process of analyzing and defining all the different data your business collects and produces, as well as the relationships between those bits of data.
Support and Maintenance
We offer support and maintenance plans that account for expected and unexpected software issues across a range of devices and systems.
What Sets Us Apart?
Enterprise Grade Visuals
Visualize your data efficiently with the most beautiful, stunning, and interactive visuals. Upgrade your analytics toolkit today!
Perfectly Tailored
Every visual is carefully tailored specifically to your needs along with consultation to refine and improve your requirements. Pixel perfect is our motto!
Microsoft Standards
Being a Microsoft Partner, we ensure that every visual adheres to Microsoft’s best practices and guidelines!
View More
https://test.datellers.com/wp-content/uploads/2022/11/DATELLERS_PROMO-VIDEO_MASTER.mp4#t=1
Our Portfolio
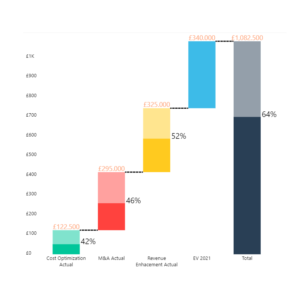
Value Bridge
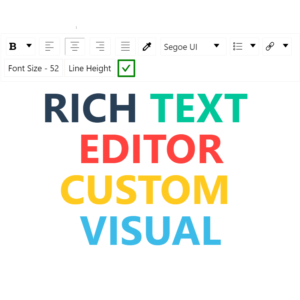
Rich Text Editor
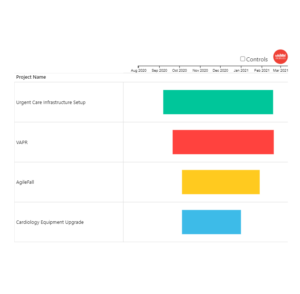
Stratada Timeline V3
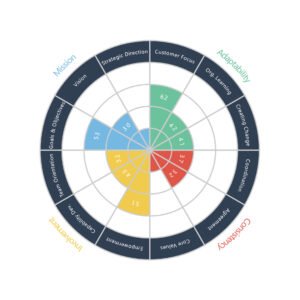
Performance Wheel
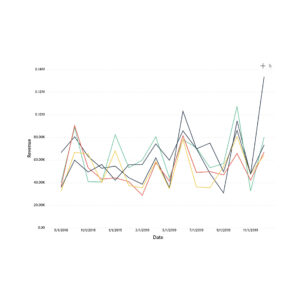
Datanauts Line Chart
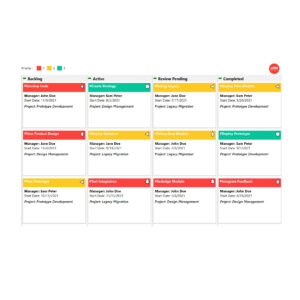
Stratada Program Taskboard

Single Point Slicer
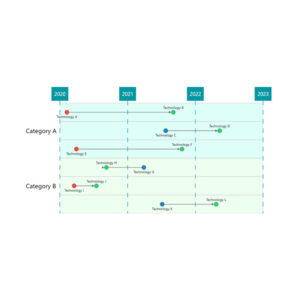
Timeline Visual
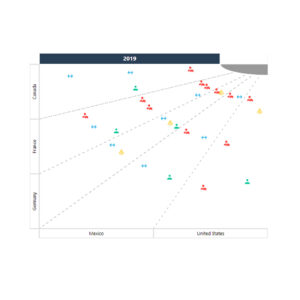
Transformation Map
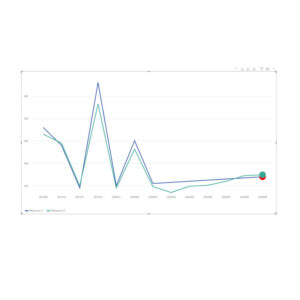
Laconic Line Chart
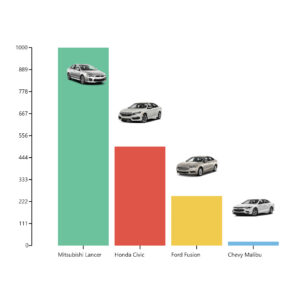
Image Bar Chart
IFrame Visual
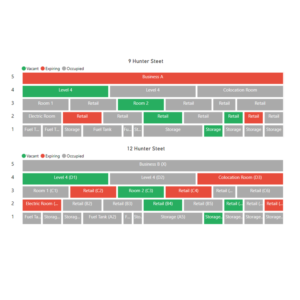
Vacancy Chart
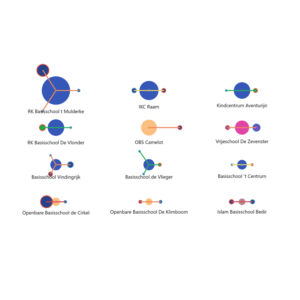
Proximity Bubble Map
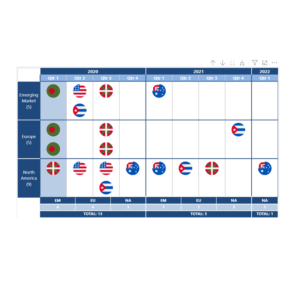
Country Matrix Visual
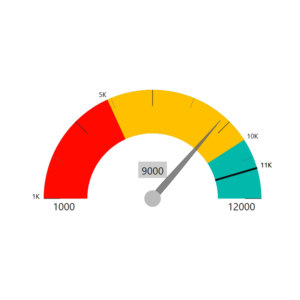
Power Gauge
View More
Portfolio-Newest
Value Bridge
Rich Text Editor
Stratada Timeline V3
Performance Wheel
Multi Axes Chart
Waterfall Chart Demo
Logo KPI
Value Bridge
Power Gauge
Proximity Bubble Map
Country Matrix Visual
Proximity Bubble Map
Our Products
Multi Axes Chart
Waterfall Chart Demo
View More
What are Custom Visuals?Power BI Custom Visuals are beautiful, trenchant and powerful analytical tools that help a stakeholder make quick and incisive decisions. A graph, map, 3d model, etc. The possibilities are unlimited!Read MoreWhy choose Custom Visuals?Power BI Custom Visuals are one of the neatest analytical open source tool available in the market today that is completely customizable to your needs!Read MoreHow are Custom Visuals built?Our visuals are built using Power BI Visuals SDK. The Power BI Visuals SDK is completely open source and therefore requires no additional licensing cost. Our visuals are built mainly using the D3 library in Typescript.Read More
Previous
Next

About Us
Datellers is a team of experts possessing deep knowledge in building Analytics. We help analytics users enhance their reporting solutions using enterprise-grade Custom Visuals curated specifically to their requirements. Our proclivity lies mainly towards Power BI Visual Development. A Chart, Map, 3D Model, etc. Datellers can build it all! A game-changing factor for any organization and industry!
What are the biggest challenges in Data visualization today?
Data visualization is becoming increasingly essential for any business. It…

Tips and tricks to create an interactive Power Bi dashboard
Power Bi dashboard is one of the most effective tools…
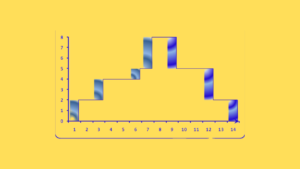
Top 6 Visualization techniques with waterfall chart in power Bi
You have undoubtedly been instinctively visualising a series of positive…
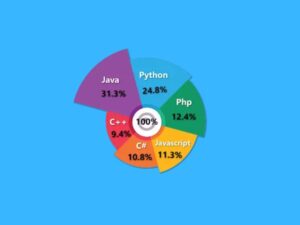
Different types of Power BI Charts
One of the key elements to improving a company’s success…
Blogs
What are the biggest challenges in Data visualization today?
Tips and tricks to create an interactive Power Bi dashboard
Top 6 Visualization techniques with waterfall chart in power Bi
Different types of Power BI Charts
What our customers have to say?
Shannon and the team are, hands down, very knowledgeable developers and have proven that they are skilled in D3, Typescript and know the Power BI development landscape very well.
It’s hard to find good developers and even harder to find ones that communicate well and are easy to work with. It takes a great deal of trust to work with someone you haven’t worked with before and trust them with your ideas. I can gladly say that Datellers have delivered on the trust. The team delivered on my requirements and design but also exchanged ideas and expertise and they truly went the extra mile.
– Vlad MihantaCEO & Founder at Datanauts
From start to finish, Datellers delivered our requirements in a timely and accurate manner. At every stage of development, from project briefing to delivery, there was clear communication and very timely iterations to the various versions as we reached the final product. Needless to say, the finished application was of very high standard and aligned perfectly to the original brief.
– Joseph BakerPrincipal Consultant at Untap
Working with Datellers has been a great experience! They have quick and clear understanding of requirements, are great at communication, and their products are very high quality. Highly recommended!
– Sabrina KremerManaging Director at Stratada
Standard Power BI visuals present a lot of obstacles in creating correctly formatted and visually appealing financial reports. We needed a custom visual to enable us build financial reports in Power BI that solved these issues. Datellers was great to work with and was able to provide a quality solution that met all our requirements while meeting all deadlines. As the visual evolved they were able to quickly add new features and solve any issues that arose throughout the development process.
– Brien SheridanConsultant at deFacto Global